Your solar production is lower than estimated mainly because solar panels are rated under lab conditions (77°F / 25°C), while real rooftops get much hotter and lose 10% to 20% of peak power. Shade, dust, inverter clipping, and utility export limits also reduce daily kilowatt-hour (kWh) output.
Seeing lower numbers than your installer promised is frustrating, especially when you expect big savings. Most drops are normal seasonal shifts or simple setting issues rather than broken panels. If your output falls more than 20% below your estimate on clear, sunny days, check your monitoring app first and compare your numbers using our free solar cost and output calculator. For hardware faults or blank screens, start with our complete solar panel troubleshooting guide.
First, Is Your Production Actually Low? (How to Check in 2 Minutes)
Before calling your installer, verify your actual production in your solar monitoring app rather than guessing from your monthly electric bill. Many apparent drops are caused by higher household electricity usage or a disconnected Wi-Fi signal.
Check Your Monitoring App, Not Your Electric Bill
A higher utility bill does not mean your solar panels stopped working. Your electric bill only measures the net power you pull from the grid after your home uses your solar energy first.
If you recently bought an electric vehicle (EV), ran your air conditioner longer during a heatwave, or added a pool pump. The, you will see that your home consumed more power before it could reach the utility meter. Utility rate changes, such as California’s NEM 3.0 export rate cut. It also shrink bill credits even when your panels produce at 100% capacity. Always check the kWh produced tab inside your Enphase, SolarEdge, or Tesla app to see true panel output.
The “Wi-Fi Disconnect” Illusion
If your monitoring app shows zero or missing production bars, your panels are likely still generating power while your gateway is offline. Solar inverters and gateways rely on your home internet to upload performance data to your phone.
Changing your Wi-Fi password, replacing your router, or experiencing a weak garage signal breaks this reporting link. Your system continues feeding electricity to your home and grid normally during an internet outage. Once you reconnect the gateway to your new Wi-Fi network, the missing historical production data usually backfills automatically within 24 hours.
Formula to Calculate Your Real Expected Output
You can calculate your realistic monthly solar output by multiplying your system size by your local peak sun hours, 30 days, and an 80% efficiency factor. Certified Installers often show ideal annual averages, which look higher than real-world monthly numbers.
Use this standard engineering formula to find your baseline target:
Expected Monthly Output (kWh) = System Size (kW) × Daily Peak Sun Hours × 30 × 0.80
The 0.80 (80%) derate factor accounts for normal wire resistance, inverter conversion loss, and mild dust. For example, an 8 kW system in a U.S. state averaging 4.5 peak sun hours per day should produce roughly 864 kWh per month (8 × 4.5 × 30 × 0.80 = 864 kWh). In winter, when peak sun hours drop to 2.5 or 3 hours, that same healthy system will naturally produce 480 to 575 kWh.
For a zip-code-specific estimate that factors in your exact roof pitch and local weather history, run your system size through the free NREL PVWatts Calculator and compare its monthly breakdown against your app.
Quick Diagnosis: Match Your Output Pattern to the Cause
The shape and timing of your production graph in the monitoring app reveals the exact cause of low output. Compare what you see on your screen against the diagnostic table below.
| What You See in the App | Likely Cause | Severity | Quick Action |
| Flat top on sunny midday graphs (bell curve looks cut off) | Inverter clipping (DC-to-AC ratio limit) | Low (Normal design) | No fix needed; system is protecting the inverter. |
| Gradual 5%–20% drop over several dry months | Dust, pollen, or bird droppings (soiling loss) | Low | Rinse panels gently with water on a cool morning. |
| Sharp dip at the same hour every afternoon | New tree growth or neighbor’s roof casting shade | Medium | Trim nearby branches safely from the ground. |
| Output capped at your exact home usage (zero export) | Pending PTO or zero-export battery setting | Medium | Confirm Permission to Operate status with your installer. |
| One or two panels show 0W while others work fine | Failed microinverter, optimizer, or loose plug | High | Note the panel serial number and call for warranty service. |
| Entire system drops to 0W on a clear day | Tripped AC solar breaker or inverter fault | High | Check your main electrical panel for a tripped breaker. |
6 Main Reasons Why Your Solar Production Is Lower Than Estimated
Most residential solar shortfalls come from six specific factors: roof heat, inverter clipping, shade or dirt, roof angle, hardware faults, and utility export limits. Understanding which factor affects your roof prevents unnecessary repair bills and helps you fix real faults fast.
1. High Roof Temperatures & Temperature Coefficient Loss
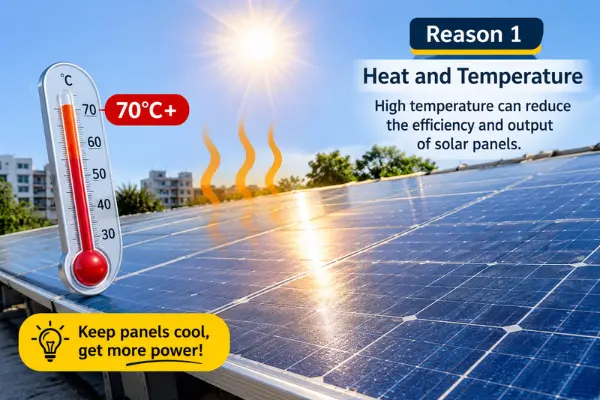
Solar panels lose 10% to 20% of their rated wattage on hot summer afternoons because high heat increases electrical resistance inside silicon cells. Manufacturers test panel output in a lab at 77°F (25°C), known as Standard Test Conditions (STC).
On a sunny 95°F afternoon in states like Texas, Arizona, or Florida, dark rooftop panels easily reach 140°F to 150°F. Every solar panel has a temperature coefficient (typically -0.30% to -0.40% per °C). Once cell temperatures climb 35°C above lab conditions, a 400-watt panel naturally drops to roughly 340–355 watts. This heat loss is normal physics, not a panel defect.
2. Inverter Clipping (Undersized Inverter Design)
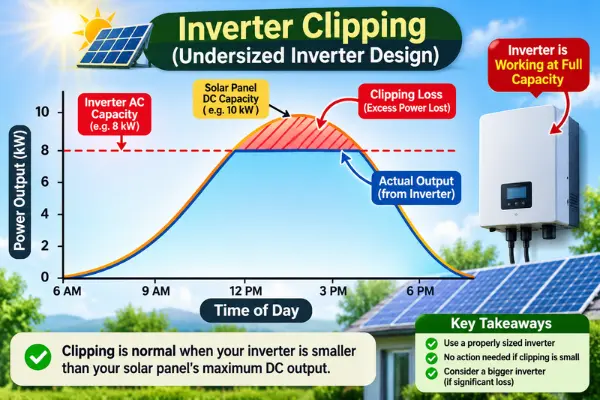
Inverter clipping happens when your solar panels produce more DC electricity than your inverter’s maximum AC limit can convert, flattening the top of your midday production graph. Installers intentionally pair larger solar arrays with slightly smaller inverters (a 1.15 to 1.30 DC-to-AC ratio) to save you equipment costs and boost morning and late-afternoon power.
For example, pairing a 9.6 kW DC panel array with a 7.6 kW AC string inverter causes the inverter to cap peak midday output at 7.6 kW for two or three hours on cool, clear spring days. Across an entire year, clipping typically trims only 1% to 3% of total kWh, which is far cheaper than buying a larger inverter.
3. Unaccounted Shading, Dust, or Pollen Buildup (Soiling Loss)
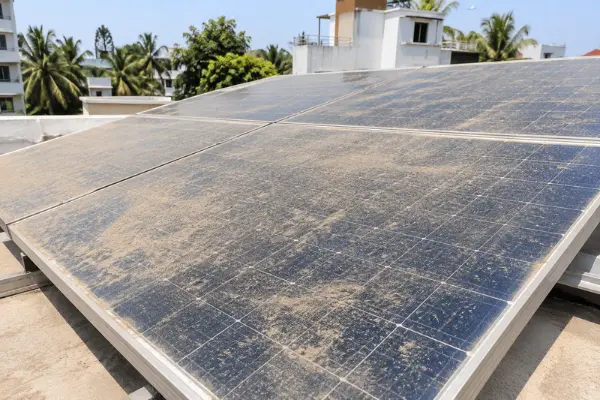
A thin layer of pollen, dust, or bird droppings blocks sunlight and reduces solar production by 5% to 25%, while new tree shade can drop output even further. In dry or agricultural U.S. regions, dust coats the glass over months without heavy rain.
Shading hurts string inverter systems the hardest. If a tree branch casts a shadow over just 10% of one panel in a traditional string setup, power drops across the entire connected row of panels. Even with microinverters, afternoon shadows from growing trees or chimneys cut daily kWh totals compared to your installer’s initial roof simulation.
4. Wrong Roof Orientation (Azimuth), Tilt, or Seasonal Sun Angle
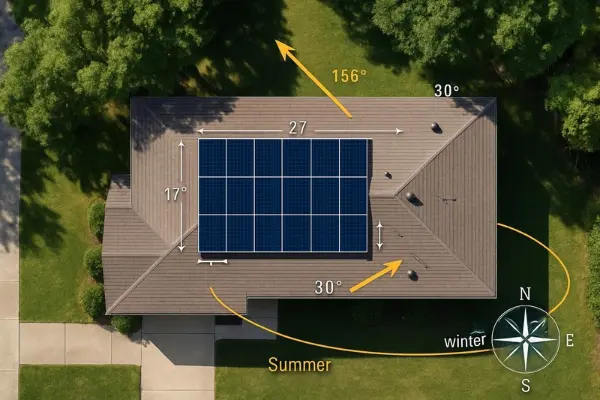
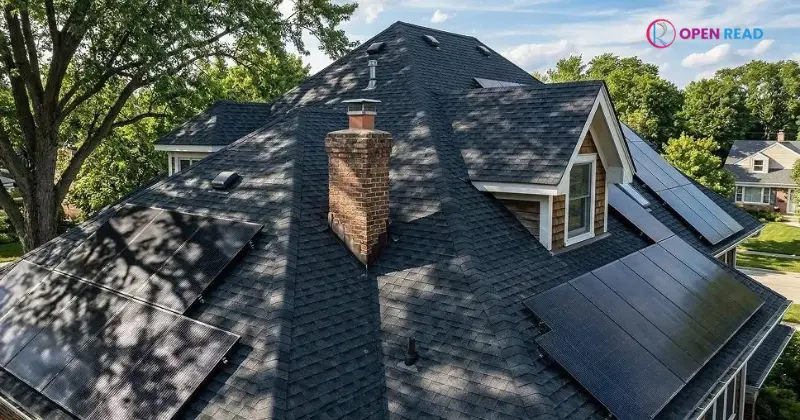
Panels facing east, west, or north produce 10% to 35% less energy than south-facing panels in the United States. While true south (180° azimuth) captures maximum daily sunlight, many homes require east-west roof splits due to roof shape or HOA rules.
Seasonal sun angles also create expected dips. Between November and February, the sun sits lower in the southern sky and days are shorter. A system designed to hit 1,000 kWh in June may produce only 550 to 650 kWh in December a normal seasonal curve that installers factor into your annual estimate, not every individual month.
5. Failed Microinverter, Optimizer, or Tripped Breaker
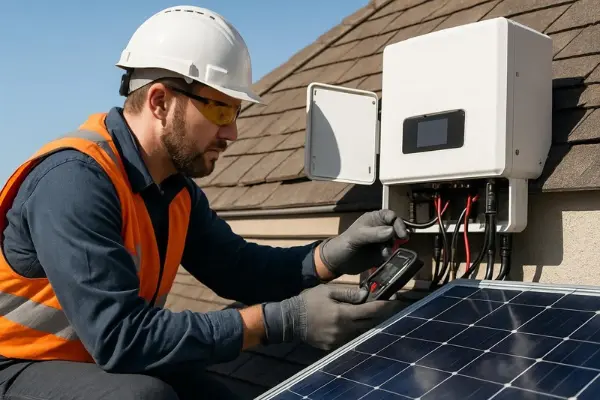
A single failed microinverter, dead DC optimizer, or tripped solar breaker can quietly knock out 5% to 100% of your solar generation. Unlike shade or heat, hardware faults cause a sudden, flat drop in your monitoring app on a clear day.
- Tripped Breaker: Check your main electrical panel for a tripped 240V breaker labeled “Solar” or “PV.”
- Dead Microinverter or Optimizer: In panel-level monitoring apps (Enphase or SolarEdge), one module tile turns black or shows 0W while neighboring panels produce normally.
- Inverter Fault Code: If your central unit displays an error or warning LED, check our guide on a solar inverter showing a red light before attempting a reset. If a component has failed outside warranty, compare typical repair and swap pricing in our solar inverter replacement cost breakdown.
6. Export Limits (PTO Pending) or Battery Curtailment
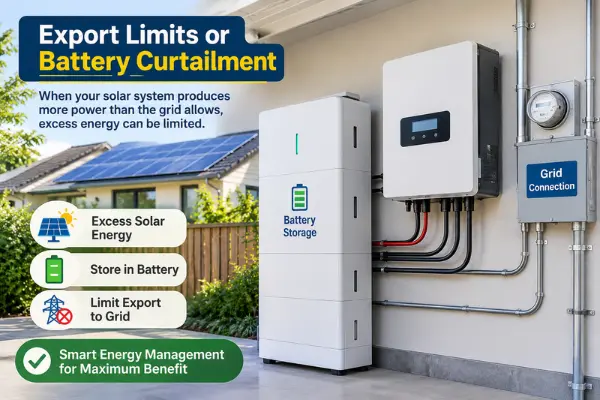
If your system was recently installed, your inverter may intentionally throttle solar output to match your home’s live appliance usage until your utility grants Permission to Operate (PTO). Installers enable this Zero-Export mode so you are not billed for sending unapproved power to the grid.
Until utility approval clears which takes weeks depending on your local Permission to Operate (PTO) timeline. Your panels shut off excess power whenever your home batteries reach 100% charge. If your system was recently installed, understanding the solar panel installation timeline can help you know when to expect utility approval and Permission to Operate (PTO).
You can spot this immediately in your app when the solar production curve mirrors your home consumption line instead of forming a smooth bell curve.
What About Panel Degradation? (Normal Aging vs. Real Fault)
Healthy solar panels naturally lose about 0.5% of their power output per year, meaning a 10-year-old system should still produce roughly 95% of its original capacity. According to data from the National Renewable Energy Laboratory (NREL), tier-1 monocrystalline panels degrade slowly due to gradual UV exposure and thermal cycling.
Use this simple benchmark to separate normal aging from an actual system fault:
Normal Aging
Your system produces 0.4% to 0.8% less each year compared to the exact same month the previous year. Most manufacturers guarantee at least 84% to 92% output at Year 25 under their performance warranty.
Real System Fault
Your production drops by 10% or more overnight, or drops more than 3% in a single year under similar weather. A sharp, sudden decline never comes from panel aging it points to a hardware failure, loose MC4 connector, shading, or an inverter setting issue.
Step-by-Step Action Plan: What to Do Next
Follow a logical, ground-level troubleshooting sequence starting with a visual scan and ending with documented evidence before paying for a technician visit. Working through these four steps protects your personal safety, keeps your equipment warranties valid, and speeds up professional repairs.
Step 1: Perform a Safe Ground-Level Visual Inspection
Walk around your yard using your phone’s zoom camera or binoculars to spot new shade, heavy pollen, or debris without ever climbing onto your roof. Steep or damp roofs pose serious fall risks, and stepping on solar modules can fracture delicate silicon cells beneath the glass.
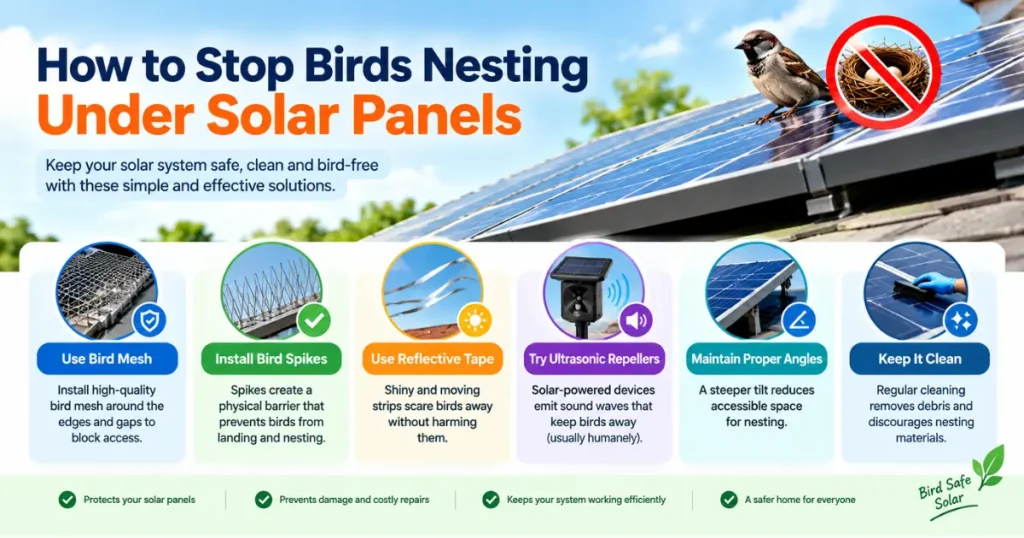
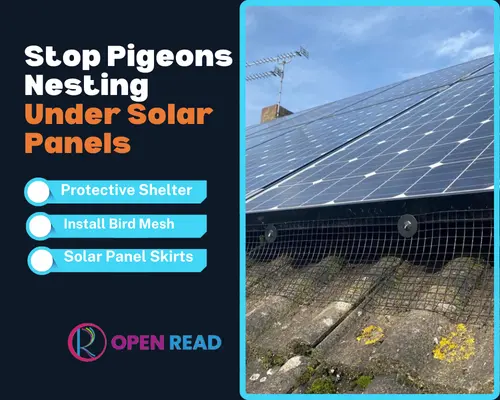
Scan the roofline around midday to see if growing tree branches or nearby structures cast shadows across the panels. Look closely along the bottom edges of the array for trapped leaves, pine needles, or animal nests. If a thick layer of dust or pollen covers the glass, rinse the panels gently from the ground with a standard garden hose early in the morning. Never spray cold water onto scorching afternoon panels, as sudden temperature shock can crack the tempered glass.
Step 2: Check Your Main Breaker and Inverter Status
Once you confirm the panels are clean and unshaded, inspect your main electrical service panel and external disconnect switches to verify every breaker is firmly ON. A single tripped 240-volt solar breaker halts all energy export immediately, even under clear blue skies.
Open your home’s main breaker box and locate the double-pole breaker labeled “Solar” or “PV.” If the switch sits loosely in the middle tripped position, push it completely OFF and then snap it firmly back ON. Next, walk over to your wall-mounted inverter clear any leaves blocking its cooling vents and write down any warning lights or fault codes on the display. Never unscrew the inverter cover or touch high-voltage DC wires yourself.
Step 3: Gather These 3 Screenshots Before Calling Your Installer
If your breakers are on and output remains low, capture three specific monitoring screenshots on a sunny day so your installer can diagnose the fault remotely. Solar support desks routinely stall or close vague service tickets that lack hard performance data.
Open your monitoring app and save clear screenshots of these three screens before making the call:
- The Daily Power Graph (kW Curve): Reveals flat midday clipping, sudden afternoon shading dips, or zero-export capping.
- The Panel-Level Array Map: Pinpoints the exact serial numbers of dead or weak modules on Enphase and SolarEdge systems.
- The Inverter Event Log & Gateway Status: Proves your internet connection is active and shows exact fault timestamps.
Step 4: What to Do If Your Solar Installer Went Out of Business (Orphan Solar)
If your original solar contractor closed down, contact the panel or inverter manufacturer directly using your hardware serial numbers to claim your active equipment warranty. Several major U.S. residential solar installers have filed for bankruptcy in recent years, leaving thousands of “orphan solar” homeowners unsure who to call for repairs.
Fortunately, your factory product warranties 10 to 12 years for string inverters and 25 years for panels and microinverters stay valid directly through manufacturers like Enphase, SolarEdge, Qcells, or REC. Call the manufacturer’s U.S. homeowner support line with your inverter serial number ready. Their engineers can run remote diagnostics on your system and connect you with a local, NABCEP-certified service contractor to complete the warranty repair.
Frequently Asked Questions
Why is my 10kW solar system only producing 7kW or 8kW?
A 10kW solar system rarely hits 10kW in real life because the 10kW rating is measured in a cool lab, while hot rooftop temperatures and inverter limits cap real-world AC output at 7.5kW to 8.5kW. This 15% to 25% gap is completely normal on sunny afternoons.
Do solar panels lose production over time?
Yes, solar panels naturally lose about 0.5% of their efficiency each year due to sun exposure and weather wear. After 10 years, a healthy system still produces around 95% of its original output, and most Tier-1 panels are warrantied to stay above 85% at year 25.
Why did my solar production drop suddenly in the summer?
Extreme summer heat actually lowers solar panel voltage, causing output to drop by 10% to 15% on 95°F+ days compared to cool, sunny spring days. Summer afternoon thunderstorms, wildfire smoke, or heavy tree foliage can also pull monthly totals below spring peaks.
Does my solar warranty cover low production?
Standard equipment warranties cover broken hardware like dead microinverters, not low output caused by shade, dirt, or bad weather. However, if your installer contract includes a specific Production Guarantee, they must repair the issue or reimburse you if output falls below their promised threshold.
Conclusion
Lower solar production usually stems from normal rooftop heat, seasonal sun angles, or inverter clipping rather than broken panels. Always verify your daily kWh graph in your monitoring app first, and contact your installer with screenshots only if output drops more than 20% below your local NREL PVWatts estimate.